We develop your web and app projects without limitations...
By using standard development procedures, generic proven building blocks and lots of experience we create secure, stable, easy to use, high performance and good looking applications that can scale with your business. Xsdot develops e-commerce, content management, crm and erp applications in the cloud. We automate any process for commercial companies, foundations and the government. We develop for the following platforms:

Web / cloud app development

Android app development

IOS app development
..in the design that fits your business and brands...
Design is an important part of an application. Your apps and sites that your customers and partners make use of should implement your house style design that reflects your brands and products identity.
Xsdot does not make use of standard design templates but develops the templates in-house. This way we guarantee that your house style is implemented without any design compromises. When you need a new house style or logo we work together with our top design partners.
..connecting your employees, partners and customers...
Xsdot has a lot of development experience and knowledge that enables us to automate your business processes with any external or internal services that your partners, employees and customers make use of. For example, a web-shop is not just a website but is also a business connected to a supply chain, customer base, accounting service, support service and a packing & shipping service.

..in time, without surprises...
We make sure that you get what you want in the time frame that we have agreed on. Each project starts with a customer project interview, detailed project offer, contract, plan of approach, agreements and time schedules.

..including responsive & engaging support
During the development process and after project delivery we support our solutions with engaging and responsive support. We think with you like a partner giving advise and ideas. Directly get support from our developers in a timely manner.
References
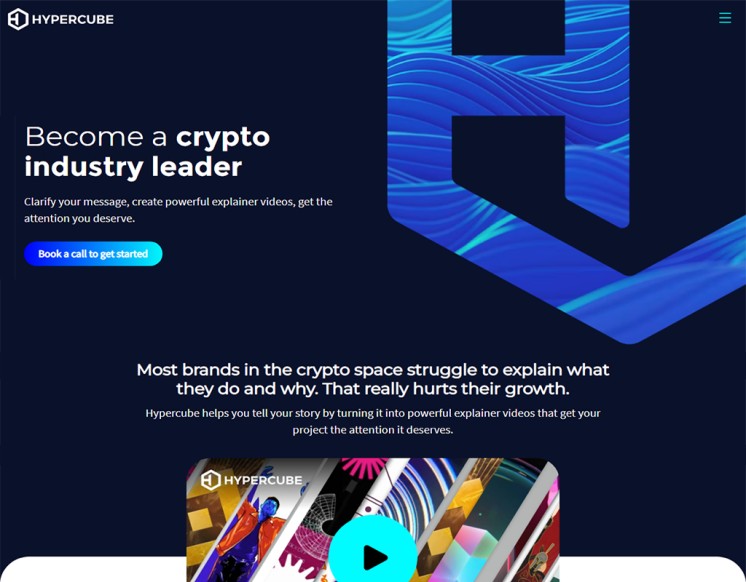
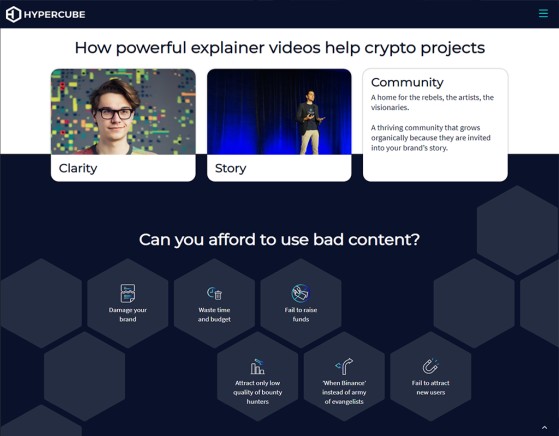
Xsdot powered example projects that have been developed together with or by our partnershypercube-agency.com
Marketing agency for the crypto industry | Hypercube. Web3, Crypto and AI marketing projects.. Visit hypercube-agency.com for more information.
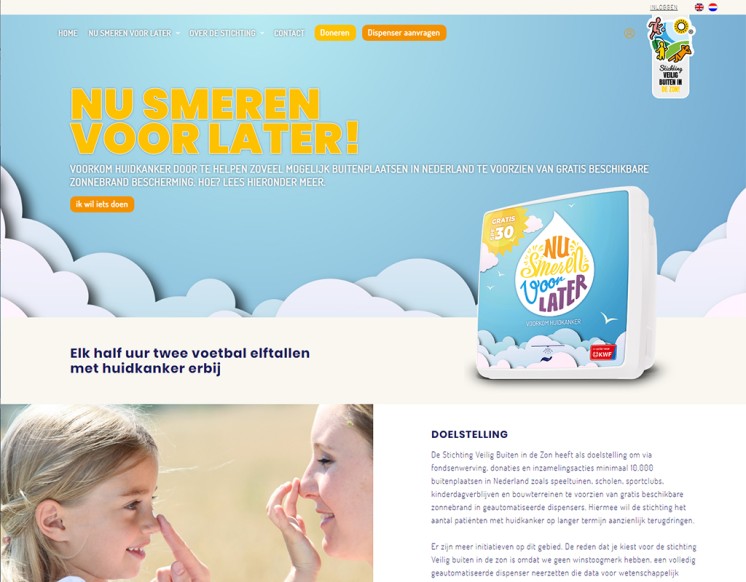
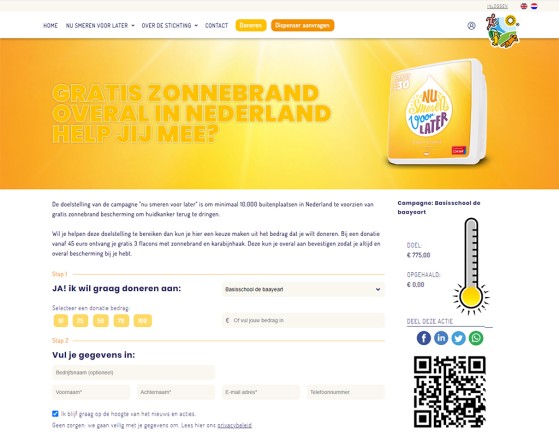
veiligbuitenindezon.nl
Prevents skin cancer by helping to provide as many locations in the Netherlands as possible with freely available sunscreen protection.. Check it out at veiligbuitenindezon.nl
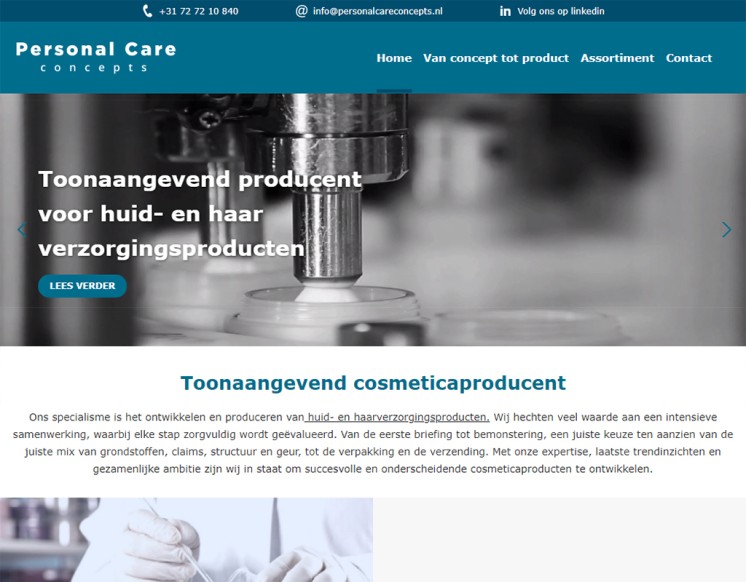
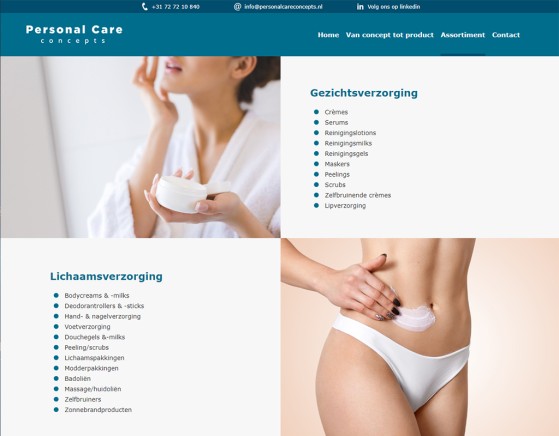
personalcareconcepts.nl
Personal care concepts is specialized in the development and production of skin and hair care products.. Check it out at personalcareconcepts.nl
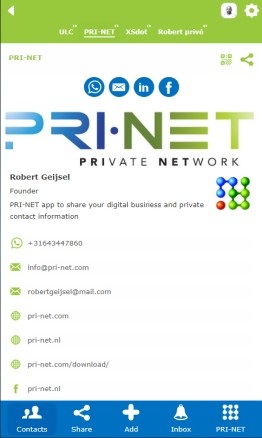
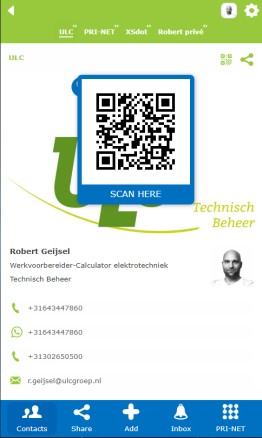
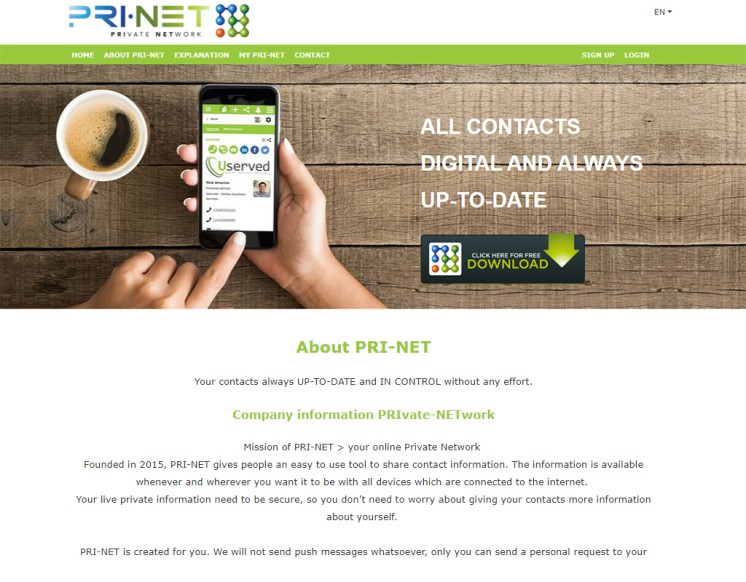
pri-net.com
The the Swiss army knife for contact related apps and contact management systems like paperless smart business cards and company contact management in the cloud. Check it out at pri-net.com
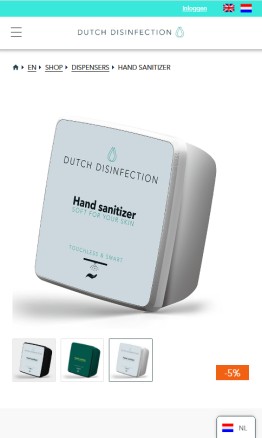
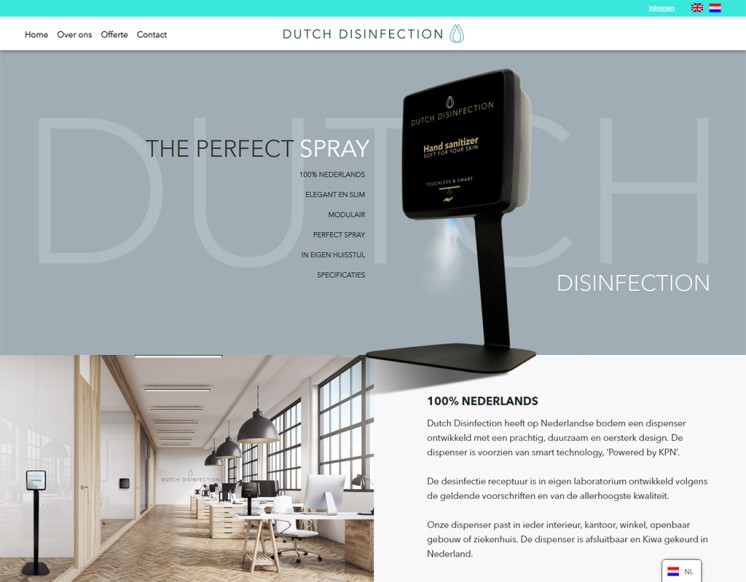
dutchdisinfection.com
Dutch Disinfection is a supplier of managed smart disinfection dispensers with refillable disinfection bottles for the business market.
dutchdisinfection.com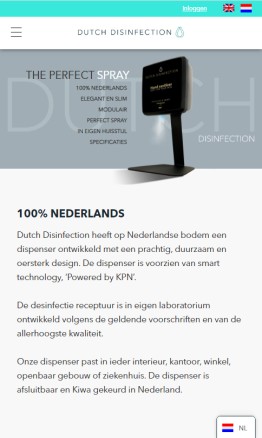
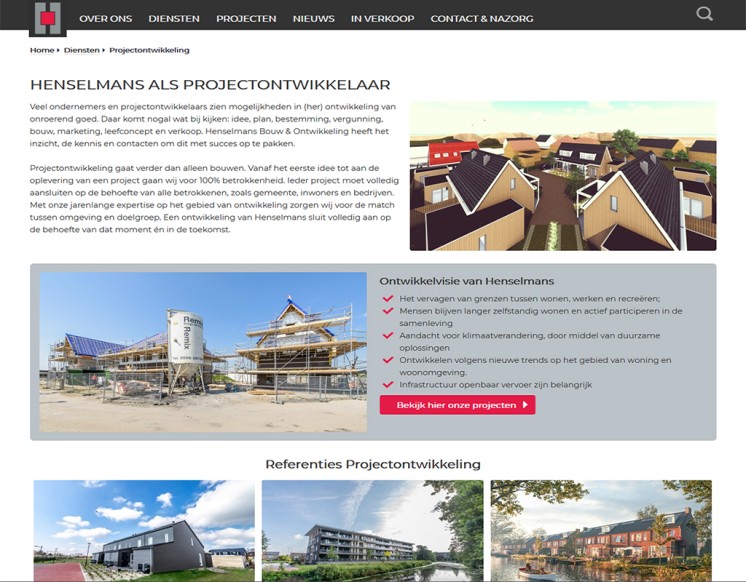
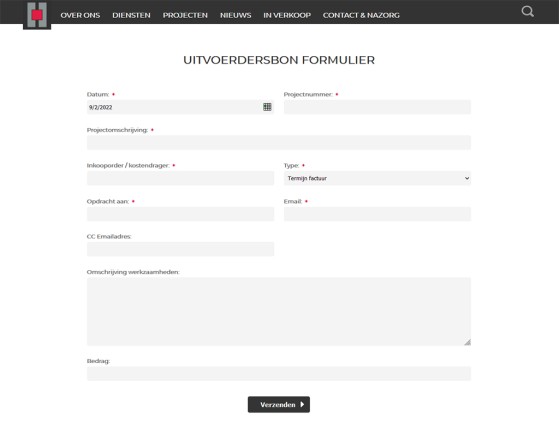
henselmans.nl
Henselmans Bouw & Ontwikkeling is a family building business in the northern part of North Holland, founded in 1878.. henselmans.nl
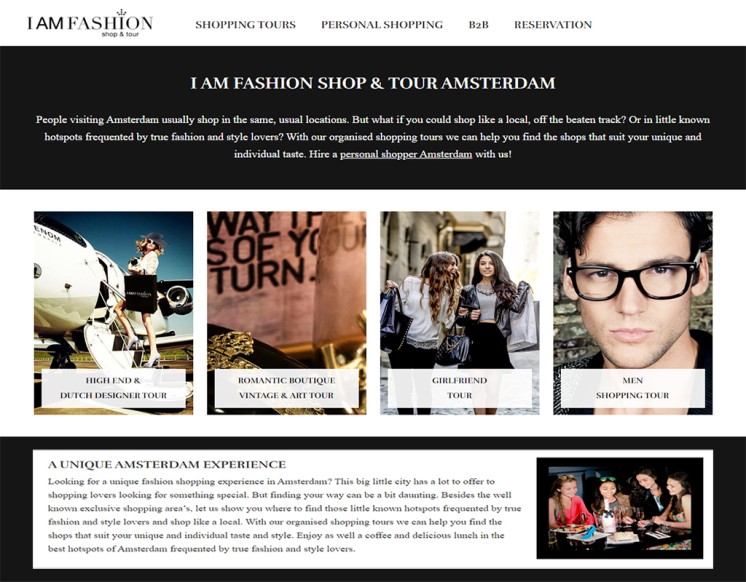
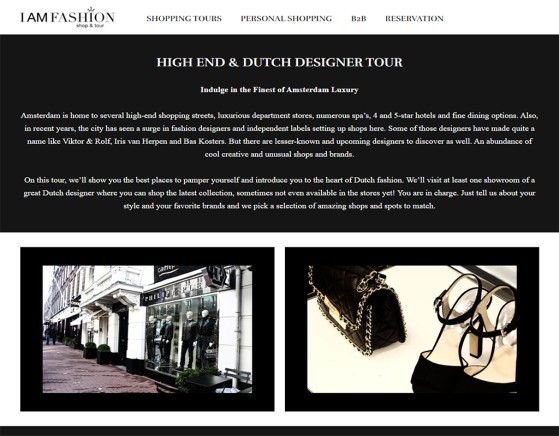
iam-fashion.com
People visiting Amsterdam usually shop in the same, usual locations. But what if you could shop like a local, off the beaten track?
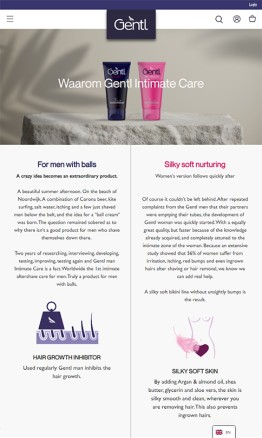
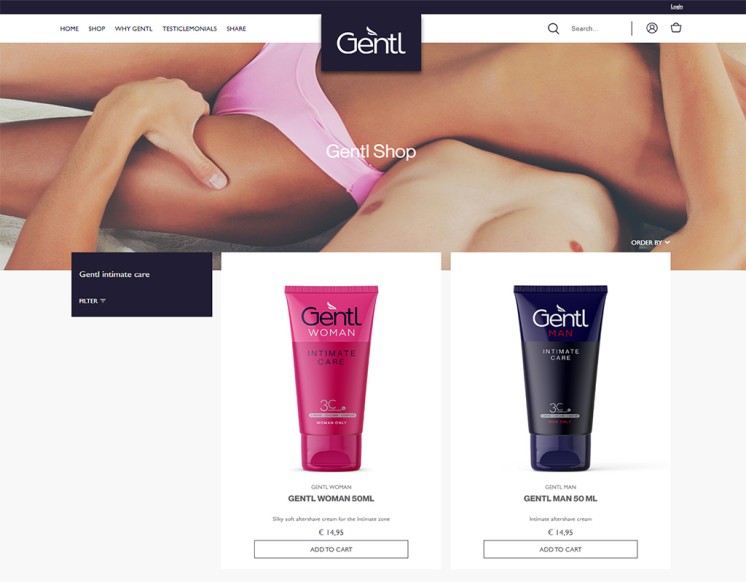
gentl.care
Soothes, cools and cares for the skin of the pubic area after hair removal. Absorbs quickly, provides immediate relief from itching, redness and irritation.
gentl.care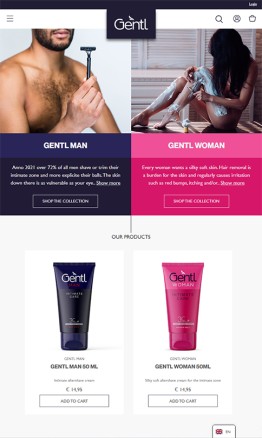
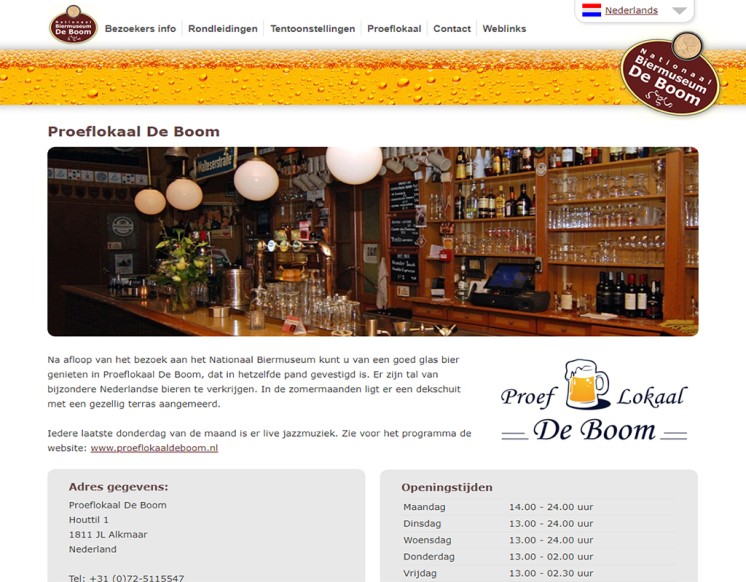
biermuseum.nl
Beer has been the most popular alcoholic beverage in these parts of the world for a few thousand years. But how is it brewed? What exactly is malt and why is yeast so important? You can find out all about it when you visit De Boom National Beer Museum in Alkmaar.
biermuseum.nl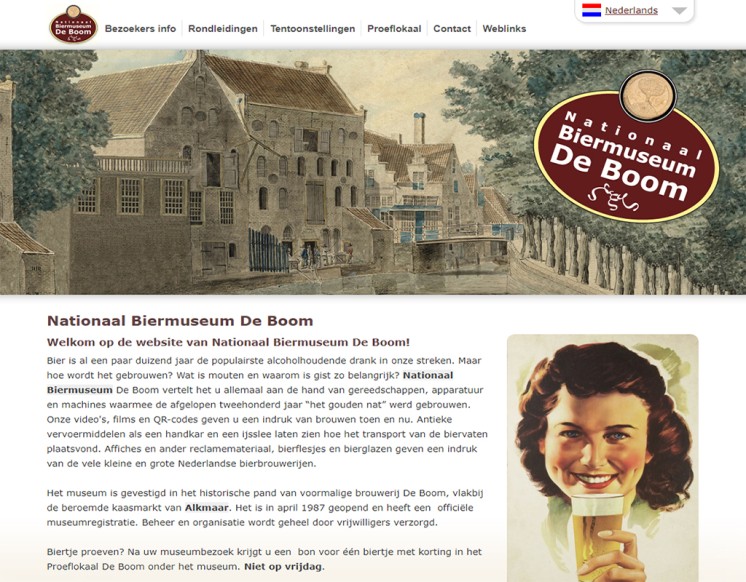
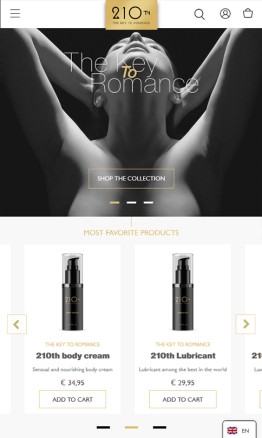
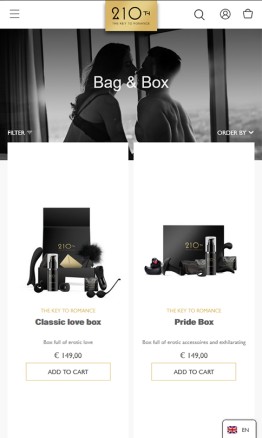
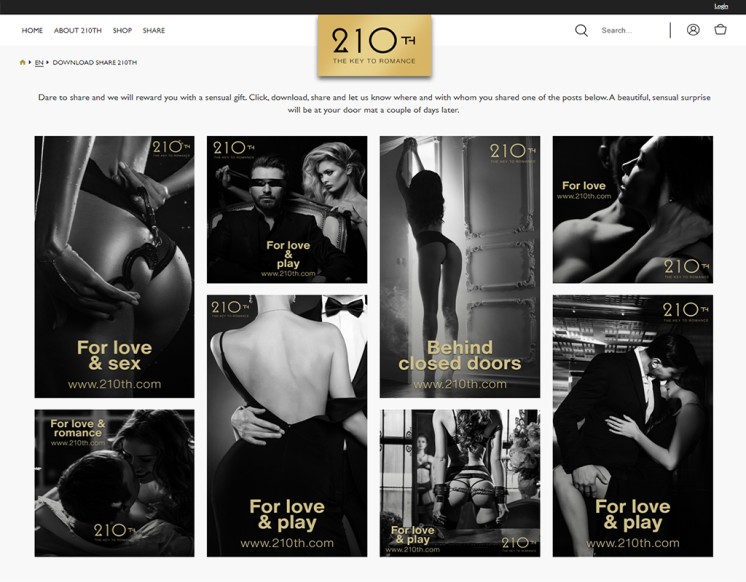
210th.com
Custom made website design, automatic donation system, automated accounting, invoicing and payment systems, multi language.
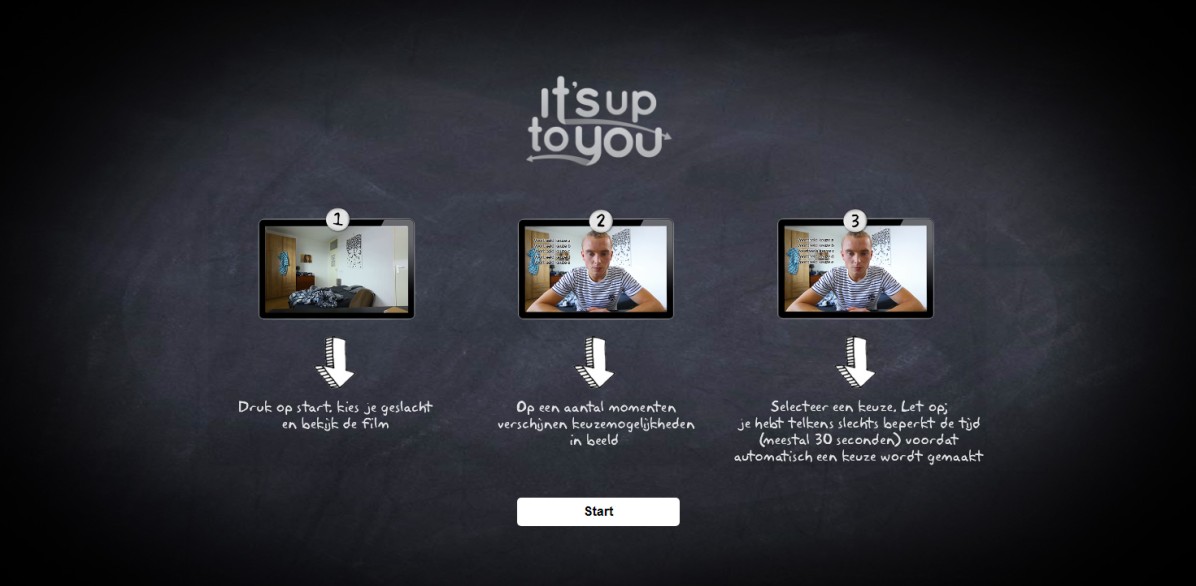
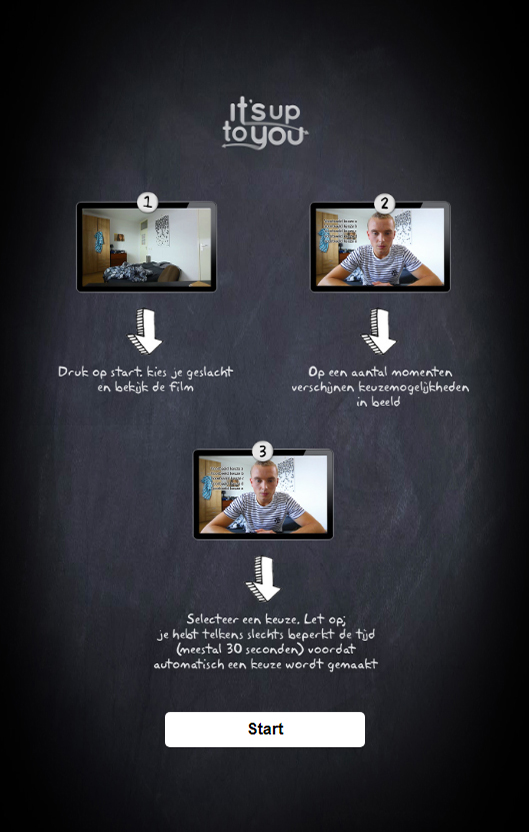
itsuptoyou.nu
Lesmethode tegen cyberpesten, t's up to you is een interactieve film die als lesmethode tegen cyberpesten wordt ingezet op scholen. Leerlingen bepalen zelf de keuzes van de hoofdpersoon en creëren hun eigen persoonlijke verhaal waarin ze de gevolgen van hun acties ervaren. itsuptoyou.nu
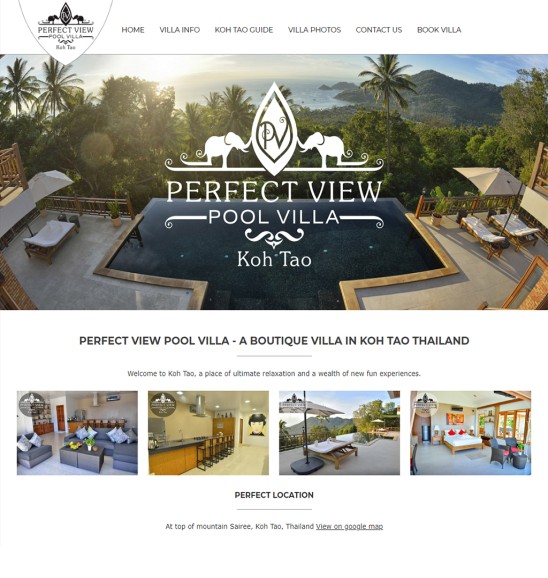
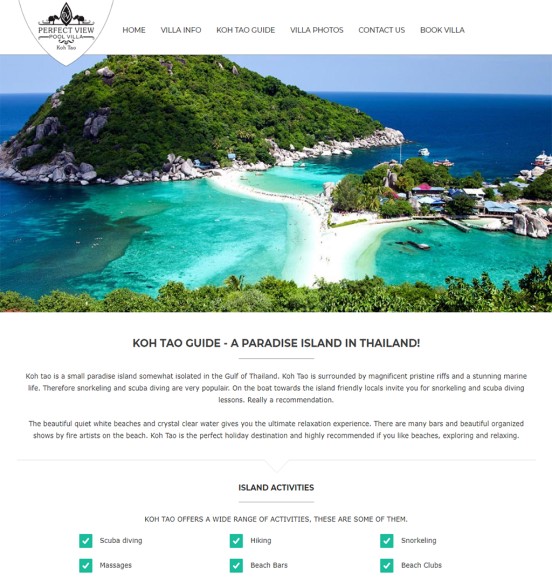
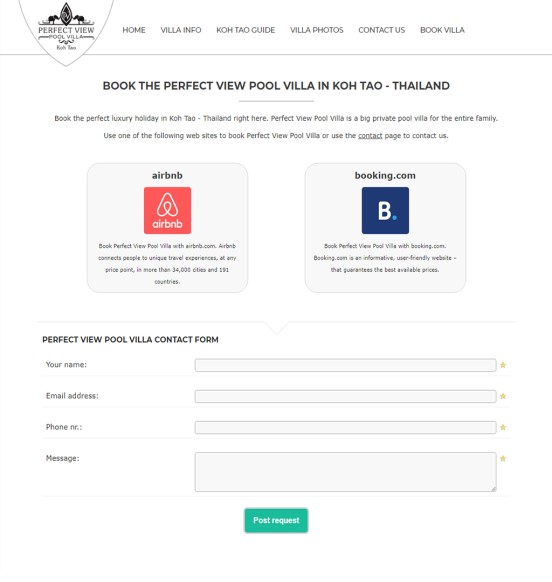
perfectviewpoolvilla.com
Perfect View Pool Villa - a boutique villa in Koh Tao Thailand. Welcome to Koh Tao, a place of ultimate relaxation and a wealth of new fun experiences.
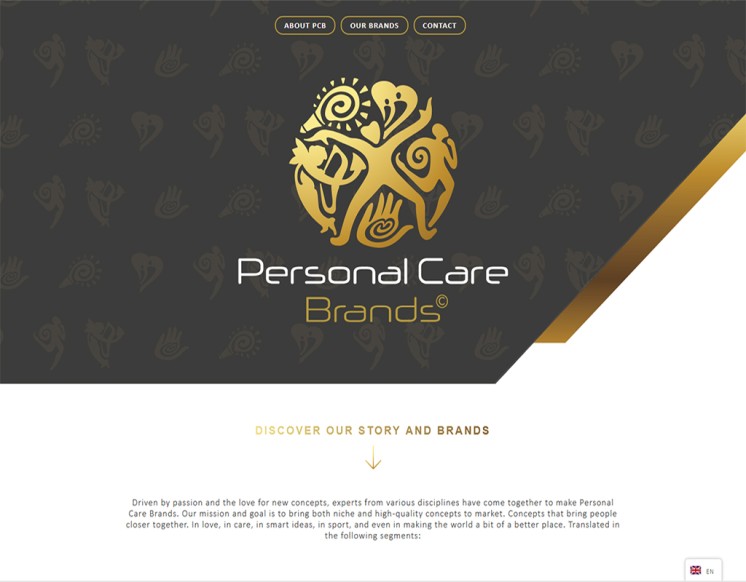
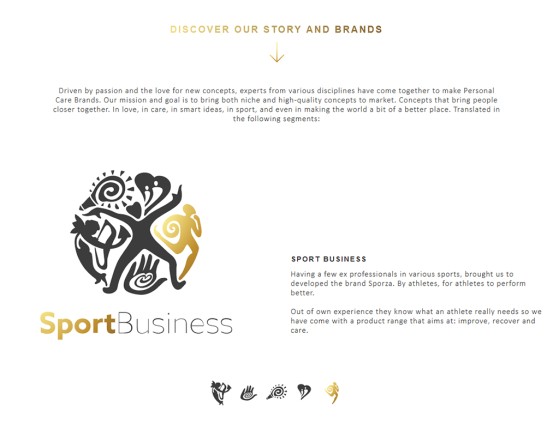
personalcarebrands.eu
Driven by passion and the love for new concepts, experts from various disciplines have come together to make Personal Care Brands. Our mission and goal is to bring both niche and high-quality concepts to market.
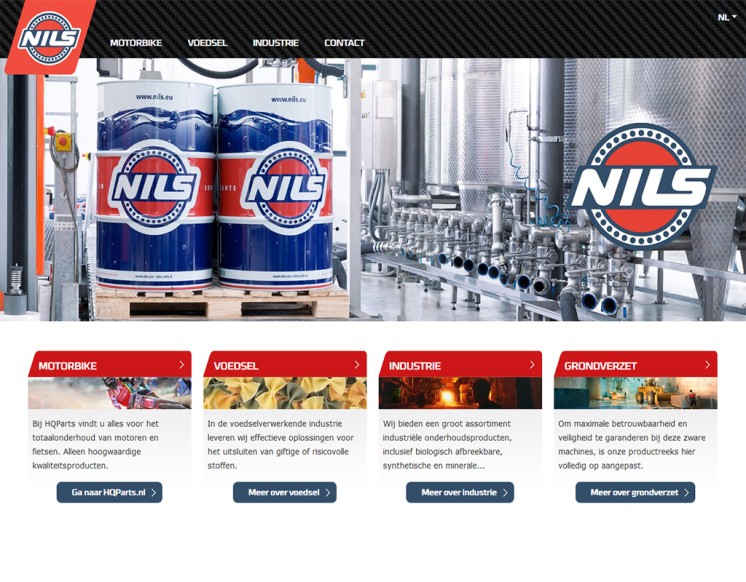
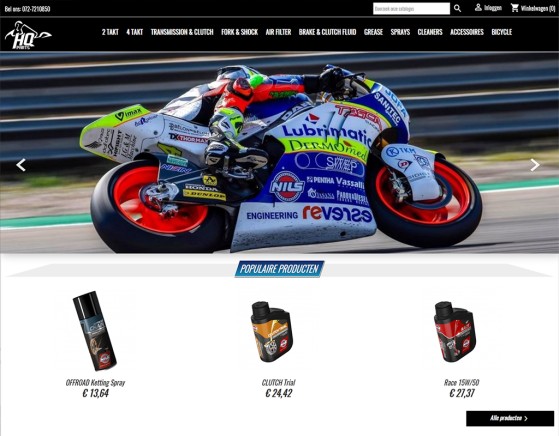
hqlubrication.nl
The motorbike sector is our Passion. Since 1971 we have been producing and marketing high-performance quality lubricants and lubrication systems for motorbikes and bicycles.
We are