Sessions and actions

The sessions and actions statistics show sessions (unique visitors) and actions (for example page clicks) in a chosen time frame (year, month, week, etc.)
Module options
The following two filter options are available,
Grouping filter
Enables or disables the grouping filter. The grouping filter, groups sessions that behave as single sessions but actually are single visitors. By enabling this filter you get a more realistic number of visitors.
Robot filter
Enables or disables the robot filter. The robot filter, filters out robots (for example search engines). By enabling this filter you get a more realistic number of visitors.
Graphs and tables
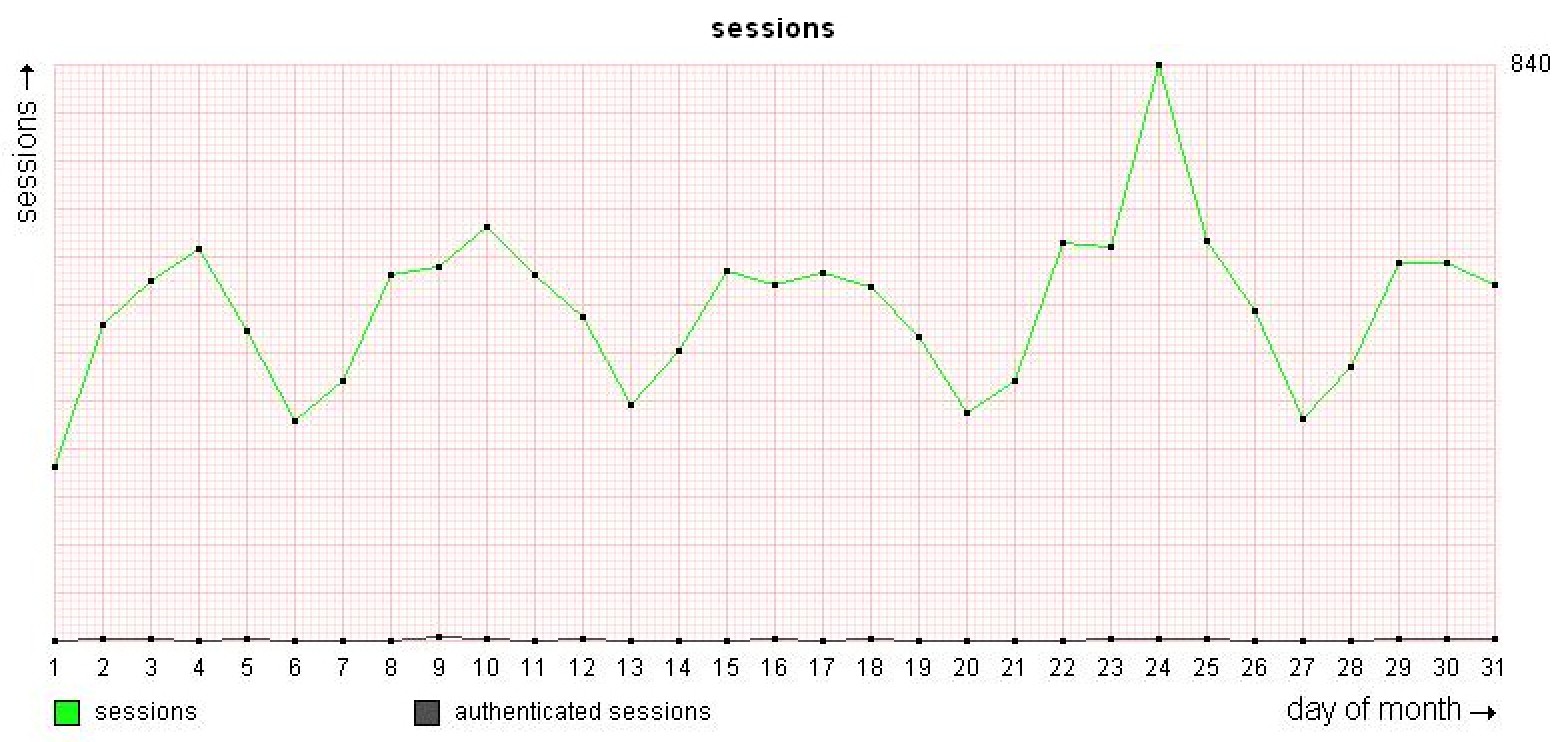
Sessions graph
Shows a graph of the sessions in a given time frame. The green line represents guest visitors and the gray line represents the authenticated visitors (visitors that have authenticated themselves by logging in).
Sessions table
| Total sessions | Total number of visitors/sessions. |
| Top sessions | Highest found concurrent sessions. |
| Average sessions | Average sessions in the given time frame. |
| Min sessions | Minimum concurrent sessions in the given time frame. |
Authenticated sessions table
| Total sessions | Total number of visitors/sessions. |
| Top sessions | Highest found concurrent sessions. |
| Average sessions | Average sessions in the given time frame. |
| Min sessions | Minimum concurrent sessions in the given time frame. |
Actions graph
Shows a graph of the actions in a given time frame. The green line represents guest visitors and the gray line represents the authenticated actions (actions of visitors that have authenticated themselves by logging in).
Actions table
| Total actions | Total number of actions. |
| Top actions | Highest found actions in the given time frame. |
| Average actions | Most actions in the given time frame. |
| Min actions | Minimum actions in the given time frame. |
Authenticated Actions table
| Total actions | Total number of actions. |
| Top actions | Highest found actions in the given time frame. |
| Average actions | Most actions in the given time frame. |
| Min actions | Minimum actions in the given time frame. |
Sessions and actions graph
Gives a graph showing the sessions against actions in a given time frame. The blue line represents the actions and the green line represents the sessions.
Statistics table
| Actions | The total and top number of actions. |
| Sessions | The total and top number of sessions. |
Average actions per session
Gives the average number of action per session. The higher the number the more interesting the visitors are in the site or application.
Authenticated sessions, authenticated actions graph
Gives a graph showing the authenticated sessions against authenticated actions in a given time frame. The blue line represents the actions and the green line represents the sessions.
Statistics table
| Authenticated actions | The total and top number of actions. |
| Authenticated sessions | The total and top number of sessions. |
Average authenticated actions per authenticated session
Gives the average number of authenticated actions per authenticated session. The higher the number the more interesting the visitors are in the site or application.